Case study · Water & environment
Anding Water Authority
Wetlands area monitoring and workflow management
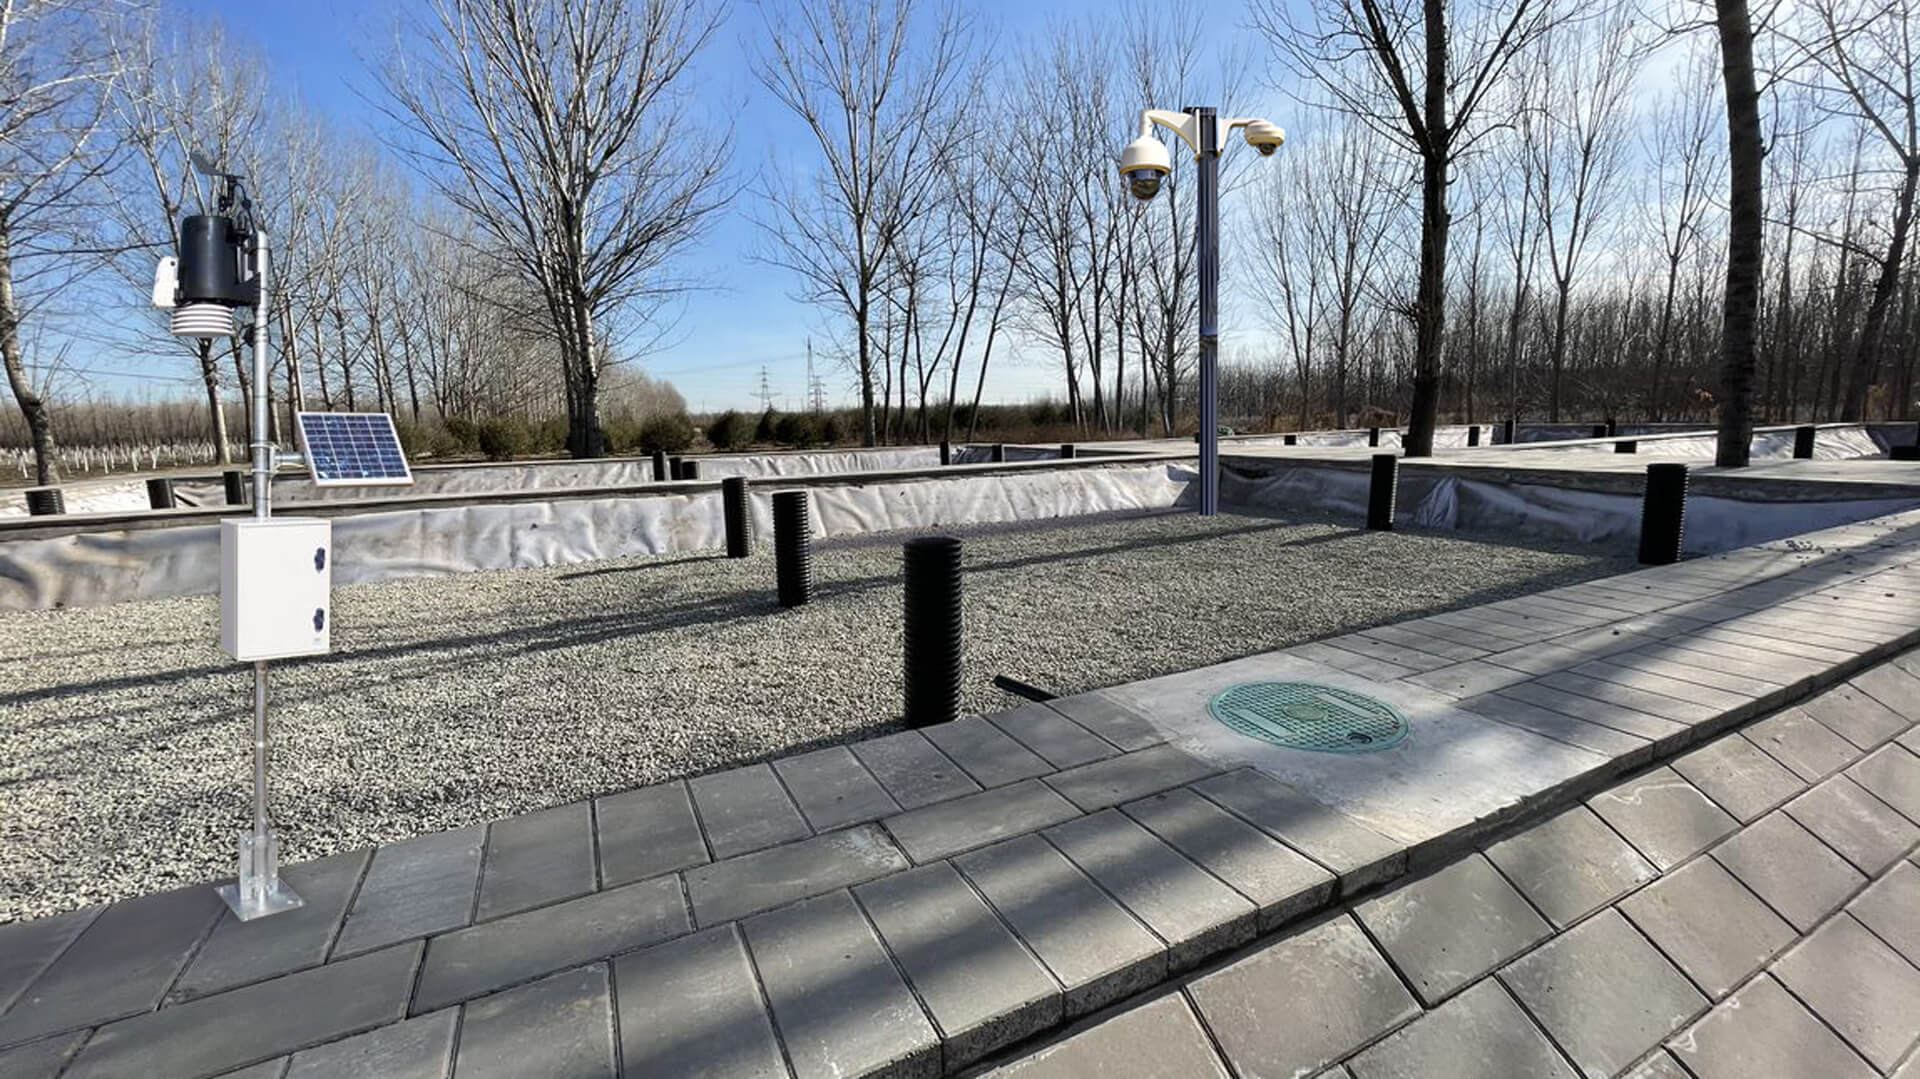
The rural population is widely distributed, with no sewage pipeline network. Domestic sewage is typically poured along the streets or discharged directly into rivers and streams, which worsens water quality and pollutes groundwater. Mixed rainwater and sewage also increase the workload of treatment and processing.
The brief
Many sites, many systems, no single view
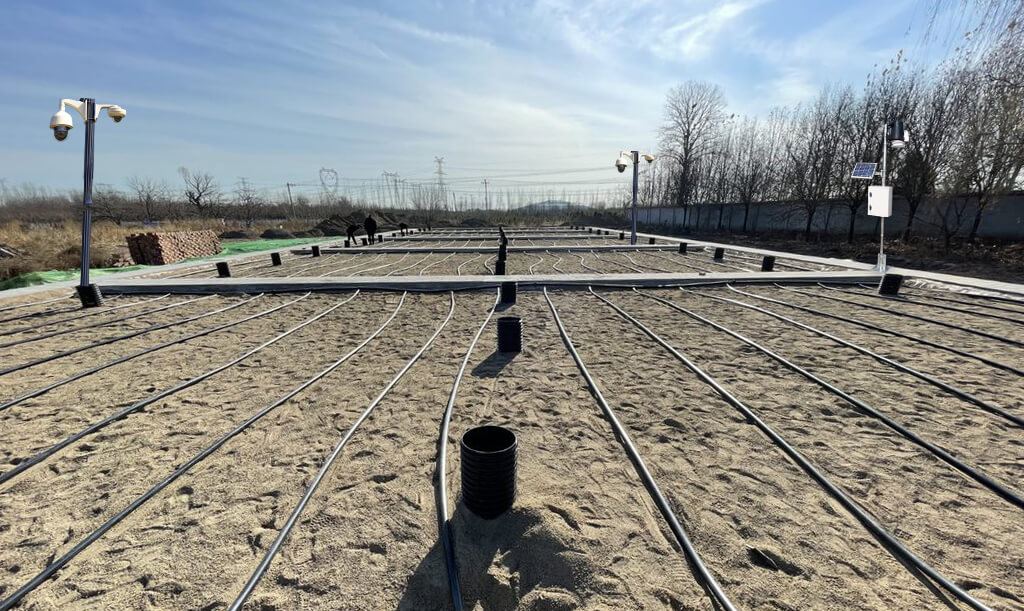
The Anding Authority established wetland areas around its water treatment plants to provide tertiary treatment of water through the natural removal of organic matter by vegetation. The wetlands are monitored and controlled through remote telemetry, PLCs and other connected assets.
Because the network was decentralised and its assets diverse, the client needed a single platform to aggregate every data source, visualise it and control assets remotely.
Our strategy
Aggregate first, then visualise
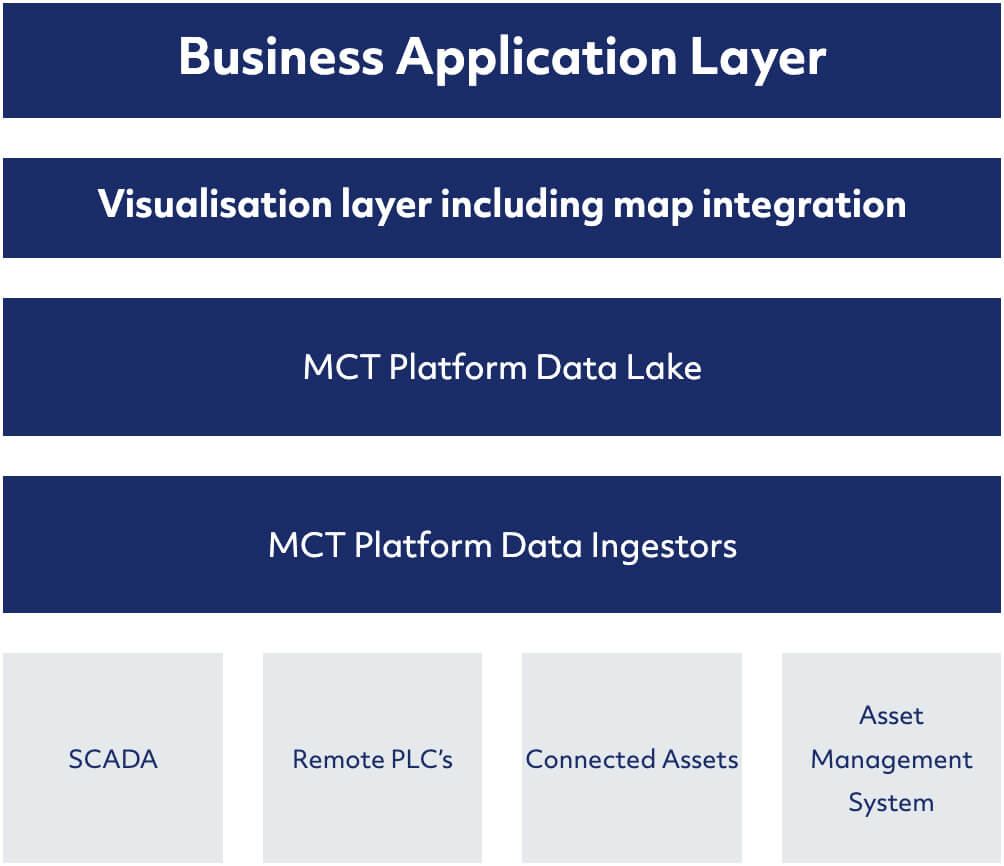
CT deployed its IoT platform to monitor and manage the network of wetland areas. We started by aggregating the client's siloed systems (water-quality stations, remote PLCs, SCADA and the asset management system) into the platform.
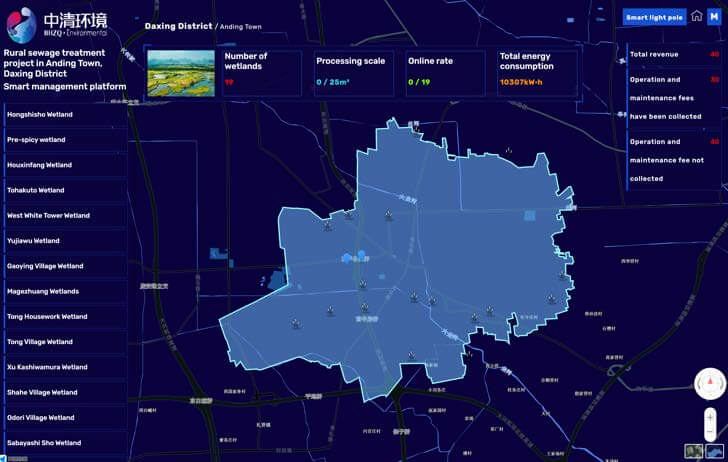
CT then created a customised dashboard with an integrated map visualisation layer.
Application & visualisation layer
Every asset on one map
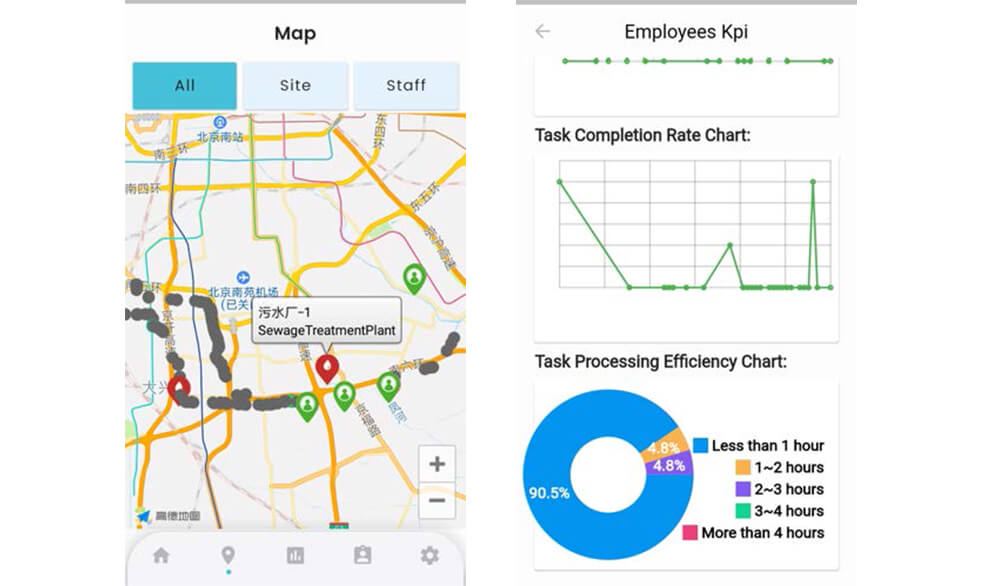
The platform ingests data from a centralised SCADA system and from remote assets distributed across the wetland areas. A GIS layer gives a single-pane view of every connected asset, making it easy to navigate, visualise critical parameters and monitor the health of vegetation within each designated wetland.
Mobile workflow management
From an alert to a work order
When the system detects water quality outside the expected range, or an equipment anomaly, it triggers an alert and assigns a work order through the mobile application to an authorised person, so the right action is taken. Every work order and maintenance task is stored in the platform and tracked against KPIs to keep service at the highest level.
Operations teams monitor data across a variety of dashboards and control equipment remotely. Because the data stays in the platform, Anding Water Authority can run statistical analysis and develop analytical models, giving it the tools for better ecological management.
Transformation
What changed.
- 01Better visibility and management of 19 wetland areas and other remote assets under their control
- 02Lower operating and maintenance costs
- 03Management decisions based on scientific data, contributing to environmental goals
More customer stories
All customers
Xinfeng Water Authority
Real-time water outlet monitoring and workflow management
Read the story
Life Pharmacy Group
IoT cold chain management for pharmacy stock
Read the story
Yahong Bridge & Hejian Water Authorities
Centralised plant control and 3D digital twin visualisations
Read the storySimilar problem?
Let's talk about yours.
Tell us what you need to monitor or automate, and we will show you how we would approach it.